Showing posts with label economics. Show all posts

Tuesday, September 19, 2017

What is the 'Law Of Diminishing Marginal Utility'?

As the quantity of a certain consumed goods increases in a specific term (when the consumption of other goods are fixed), marginal utility, which each additional unit of goods alter the total utility, gradually decrease. This is called the Law of Diminishing Marginal Utility.
In a situation that the Law of Diminishing Marginal Utility is valid, in the time that a goods or service is started being consumed, marginal utility starts decreasing from the first point while total utility is increasing at a decreasing pace. The relations between Total Utility and Marginal Utility can also be summarized as seen on the below.

MU makes an impact on the direction of TU. As a consequence,
  • While TU is increasing, MU is always positive.
  • While TU is decreasing, MU takes negative values.
  • When TU is maximum, MU is zero.
(These consequences can be found out by checking on the chart below)


Example of Diminishing Marginal Utility
Suppose an individual who is quite hungry. She can buy a slice of pizza for $2. But, she buys five slices of pizza. She eats the first slice of pizza and gains certain positive utility from eating the food. Because the individual was quite hungry and this is the first food she consumed, the first slice of pizza has a high utility. While consuming the second slice of pizza, the individual’s appetite is becoming satisfied. She is not as hungry as before now. So, the second slice of pizza gives a smaller utility compared to the first. The third slice, compared to the before, holds even less utility because the individual is now not hungry anymore.
In fact, the fourth slice of pizza has given a diminished marginal utility as well, as it is difficult to be consumed because the individual experiences discomfort upon being full from food. Finally, the fifth slice of pizza cannot even be consumed. She is so full from the first four slices that consuming the last slice of pizza results in negative utility. The fifth slice of pizza refers the decreasing total utility and negative marginal utility that is experienced upon the consumption of any good. It is shown on the figure with arrows.

Monday, September 18, 2017

What is an ‘Increasing Opportunity Cost’ and 'Opportunity Cost'?

Increasing Opportunity Cost
The production possibility frontier (PPF) is a curve showing all maximum output possibilities for two goods, given a set of inputs consisting of resources and other factors. The PPF assumes that all inputs are used efficiently.
I will explain ‘the increasing opportunity cost’ on the production possibility frontier which is below.


The PPF is concave to the origin. It is because in order for producing a commodity more, it should be given up producing another commodity in an increasing amount.
Let's consider the point A on the figure (produced 28 mobile phones, 10 cameras). In order for producing 10 more cameras, it has to be given up 4 mobile phones. It is indicated point B on the figure.
When it is moved forward point C, it has to be given up 6 mobile phones in order for producing 10 more cameras.
On the point D, it has to be given up 8 mobile phones in order for producing 10 more cameras which are same quantity increasing on each point.
As it is seen on each point, in order for having output of 10 more cameras, it is sacrified mobile phones an increasing quantity on each point. This is called 'Increasing Opportunity Cost'.

Opportunity Cost

Needs of human being are infinite. But, goods and services produced in order for satisfying infinite human needs are always scarce. In other saying, there is an imbalance between the quantity of goods and services produced with the intent of satisfying infinite human needs and finite natural resources. It is defined as the Law of Scarcity.
Because it is not possible to satisfy infinite human needs with finite resources, satisfying of some needs are needed to be given up or delayed. At this point, the logic of opportunity cost comes up. Opportunity cost refers to a benefit that a person could have received, but gave up, to take another course of action which is more beneficial.

An Example of Opportunity Cost?

Suppose you have 1 million dollars under-the-mattress saving. You have two options to use the money.

Option one: You can invest your money to deposit account with %10 annual percentage yield.

Option two: You can start your own business with %20 annual percent gain.

But, you don't have enough time and energy to start a new business. So, you are investing your money to deposit account with the %10 annual percentage yield. The opportunity cost of investing your money to deposit account is the %20 annual percent gain you could have got for starting a business.


Sunday, September 17, 2017

The Law of Scarcity, The Definition of Economics and the ‘Production Possibility Frontier-PPF’

The law of scarcity simply notes that economic resources — land, labor, capital, and talent — are limited, not infinite. This assumption is easily verifiable by noting that if resources had been infinite, everything should have been free; because it is not, scarcity must exist.

The definition of Economics comes up with the factuality of the Law of Scarcity: It is the study of the production and distribution of goods and services to satisfy humans’ finite wants and needs with scarcity resources.

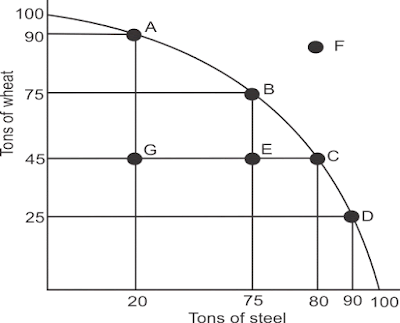
The Production Possibility Frontier-PPF is generated because of the Law of Scarcity. It is a curve representing all maximum output possibilities of two different goods, given a set of inputs consisting of resources and other factors which are finite in nature.

The PPF refers to the production possibilities of two commodities when resources are fixed. This means that the production of one commodity can only increase when the production of the other commodity is reduced due to the availability of resources. It represents the point at which a country’s economy is most efficiently producing its goods and services and, therefore, allocating its resources in the best way possible.


                                                       Production Possibility Frontier-PPF

Let’s turn to an example and consider the chart above. Imagine an economy that can produce only two things: wheat and steal. According to the PPF, points A, B, C, and D — all appearing on the PPF curve — represent the most efficient use of resources by the economy. For instance, producing 75 tons of steel and 75 tons of wheat (point B) is just as desirable as producing 80 tons of steel and 45 tons of wheat. Point G and E represents an inefficient use of resources, while point F represents the goals that the economy simply cannot attain with its present levels of resources.
As we can see, in order for this economy to produce more steel, it must give up some of the resources it is currently using to produce wheat (point A). If the economy starts producing more steel (represented by points B, C, and D), it would need to divert resources from producing wheat and, consequently, it will produce less wheat than it is producing at point A. As the figure shows, by moving production from point A to B, C, and D, the economy must decrease wheat production by a small amount in comparison to the increase in steel output. However, if the economy moves from point B to C, the wheat output will be significantly reduced while the increase in steel will be quite small. Keep in mind that A, B, and C all represent the most efficient allocation of resources for the economy; the nation must decide how to achieve the PPF and which combination to use. If more wheat is in demand, the cost of increasing its output is proportional to the cost of decreasing steel production. Markets play an important role in telling the economy what the PPF should look like.
Consider points G and E on the figure above. Being at point G and E means that the country’s resources are not being used efficiently or, more specifically, that the country is not producing enough wheat or steel given the potential of its resources. On the other hand, point F represents an output level that is currently unattainable by this economy. But, if there were a change in technology while the level of land, labor, and capital remained the same, the time required to pick steal and wheat would be reduced. The output would increase, and the PPF would be pushed outwards. A new curve, represented in the figure below on which F would fall, would then represent the new efficient allocation of resources.

A Different View of Externalities in the Context of Global Warming and Climate Change

An externality is a cost or benefit that affects a third party who did not choose to incur that cost or benefit. Externalities can be both p...