The law of scarcity simply notes that economic resources — land, labor, capital, and talent — are limited, not infinite. This assumption is easily verifiable by noting that if resources had been infinite, everything should have been free; because it is not, scarcity must exist.
The definition of Economics comes up with the factuality of the Law of Scarcity: It is the study of the production and distribution of goods and services to satisfy humans’ finite wants and needs with scarcity resources.
The Production Possibility Frontier-PPF is generated because of the Law of Scarcity. It is a curve representing all maximum output possibilities of two different goods, given a set of inputs consisting of resources and other factors which are finite in nature.
The PPF refers to the production possibilities of two commodities when resources are fixed. This means that the production of one commodity can only increase when the production of the other commodity is reduced due to the availability of resources. It represents the point at which a country’s economy is most efficiently producing its goods and services and, therefore, allocating its resources in the best way possible.
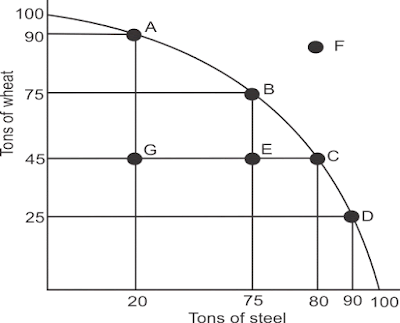
Production Possibility Frontier-PPF
As we can see, in order for this economy to produce more steel, it must give up some of the resources it is currently using to produce wheat (point A). If the economy starts producing more steel (represented by points B, C, and D), it would need to divert resources from producing wheat and, consequently, it will produce less wheat than it is producing at point A. As the figure shows, by moving production from point A to B, C, and D, the economy must decrease wheat production by a small amount in comparison to the increase in steel output. However, if the economy moves from point B to C, the wheat output will be significantly reduced while the increase in steel will be quite small. Keep in mind that A, B, and C all represent the most efficient allocation of resources for the economy; the nation must decide how to achieve the PPF and which combination to use. If more wheat is in demand, the cost of increasing its output is proportional to the cost of decreasing steel production. Markets play an important role in telling the economy what the PPF should look like.
Consider points G and E on the figure above. Being at point G and E means that the country’s resources are not being used efficiently or, more specifically, that the country is not producing enough wheat or steel given the potential of its resources. On the other hand, point F represents an output level that is currently unattainable by this economy. But, if there were a change in technology while the level of land, labor, and capital remained the same, the time required to pick steal and wheat would be reduced. The output would increase, and the PPF would be pushed outwards. A new curve, represented in the figure below on which F would fall, would then represent the new efficient allocation of resources.
